Campaign analytics
The reporting comes with the account
Cross-platform campaign dashboards are normally a separate product with a separate subscription, connected to accounts they know nothing about. Every account assigned through AF Ads arrives with its reporting already attached — account status and balance as well as campaign performance.
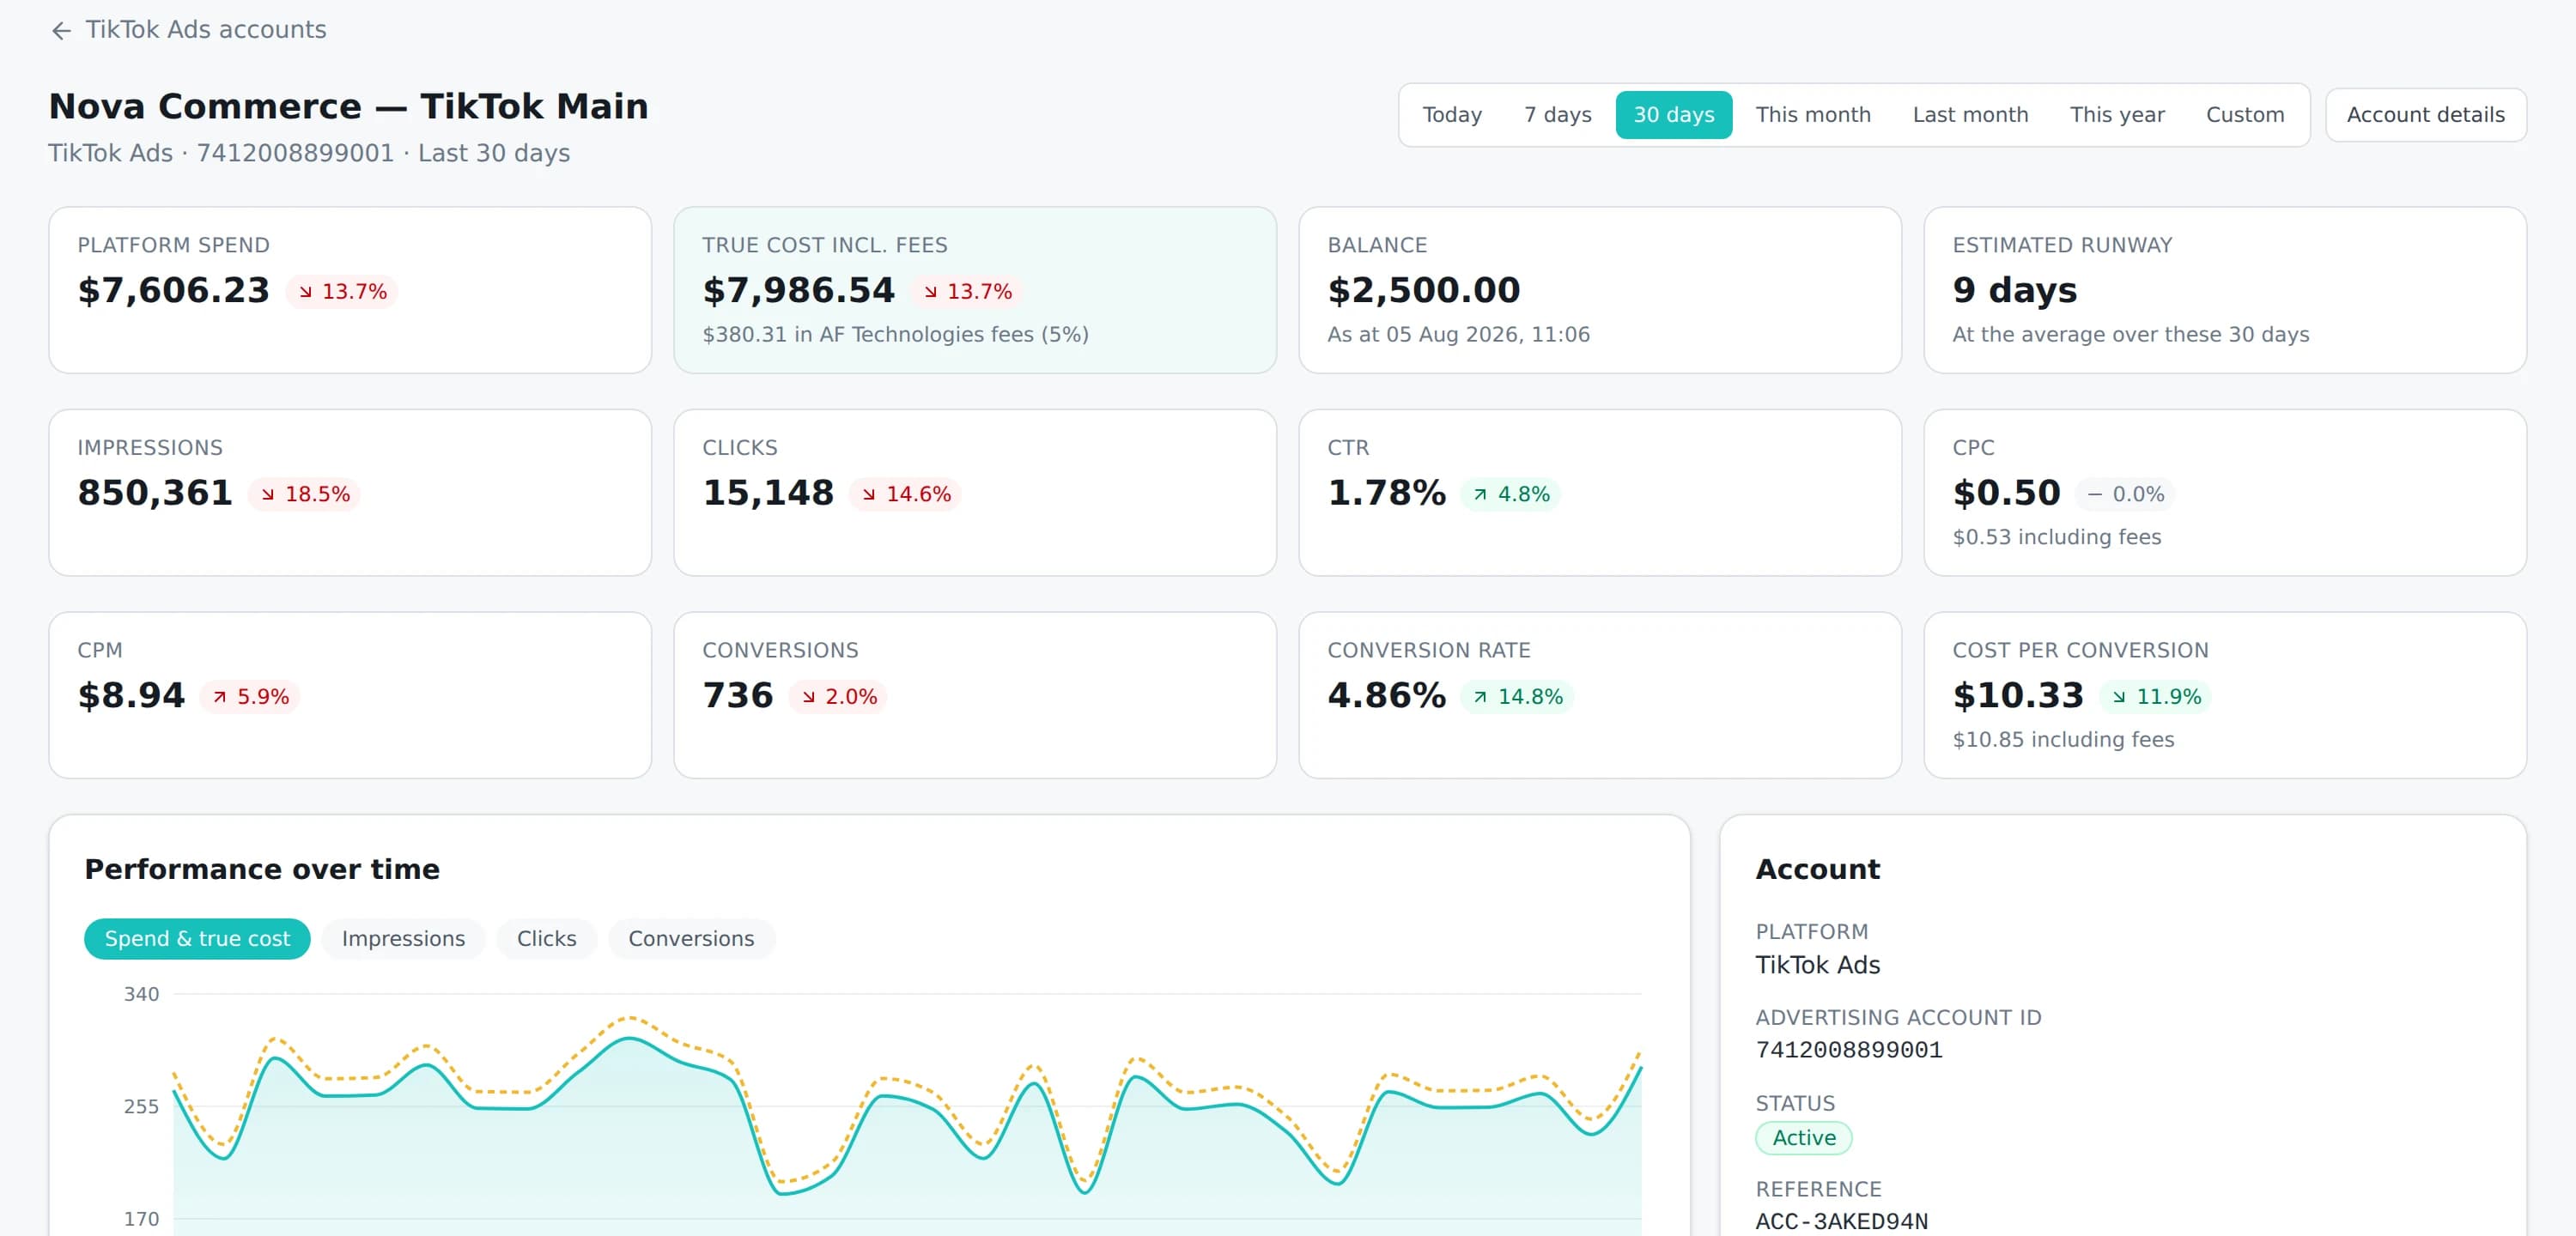
Account health
Before performance, the basics
Most reporting products start at campaign metrics. The questions asked far more often are whether an account is running and whether it has money in it, so those come first.
Account status
Whether each advertising account assigned to you is active, and what the platform currently reports about its ability to deliver. A stopped account shows up as a status rather than as a gap in a chart at the end of the month.
Balance and runway
How much is left in each advertising account, with an estimated runway calculated from recent daily spend — so the question is "when do I need to fund this" rather than "did it stop yesterday".
Funding history
Every wallet top-up and every account funding, with the service fee applied to each one. Written to an append-only ledger, so a balance can be reconciled entry by entry rather than taken on trust.
Campaign status
Delivery status for each campaign, ad group and ad as the platform reports it — including the reason where a platform has refused an ad, which is usually the fastest route to fixing it.
How it is organised
From an account down to a single ad
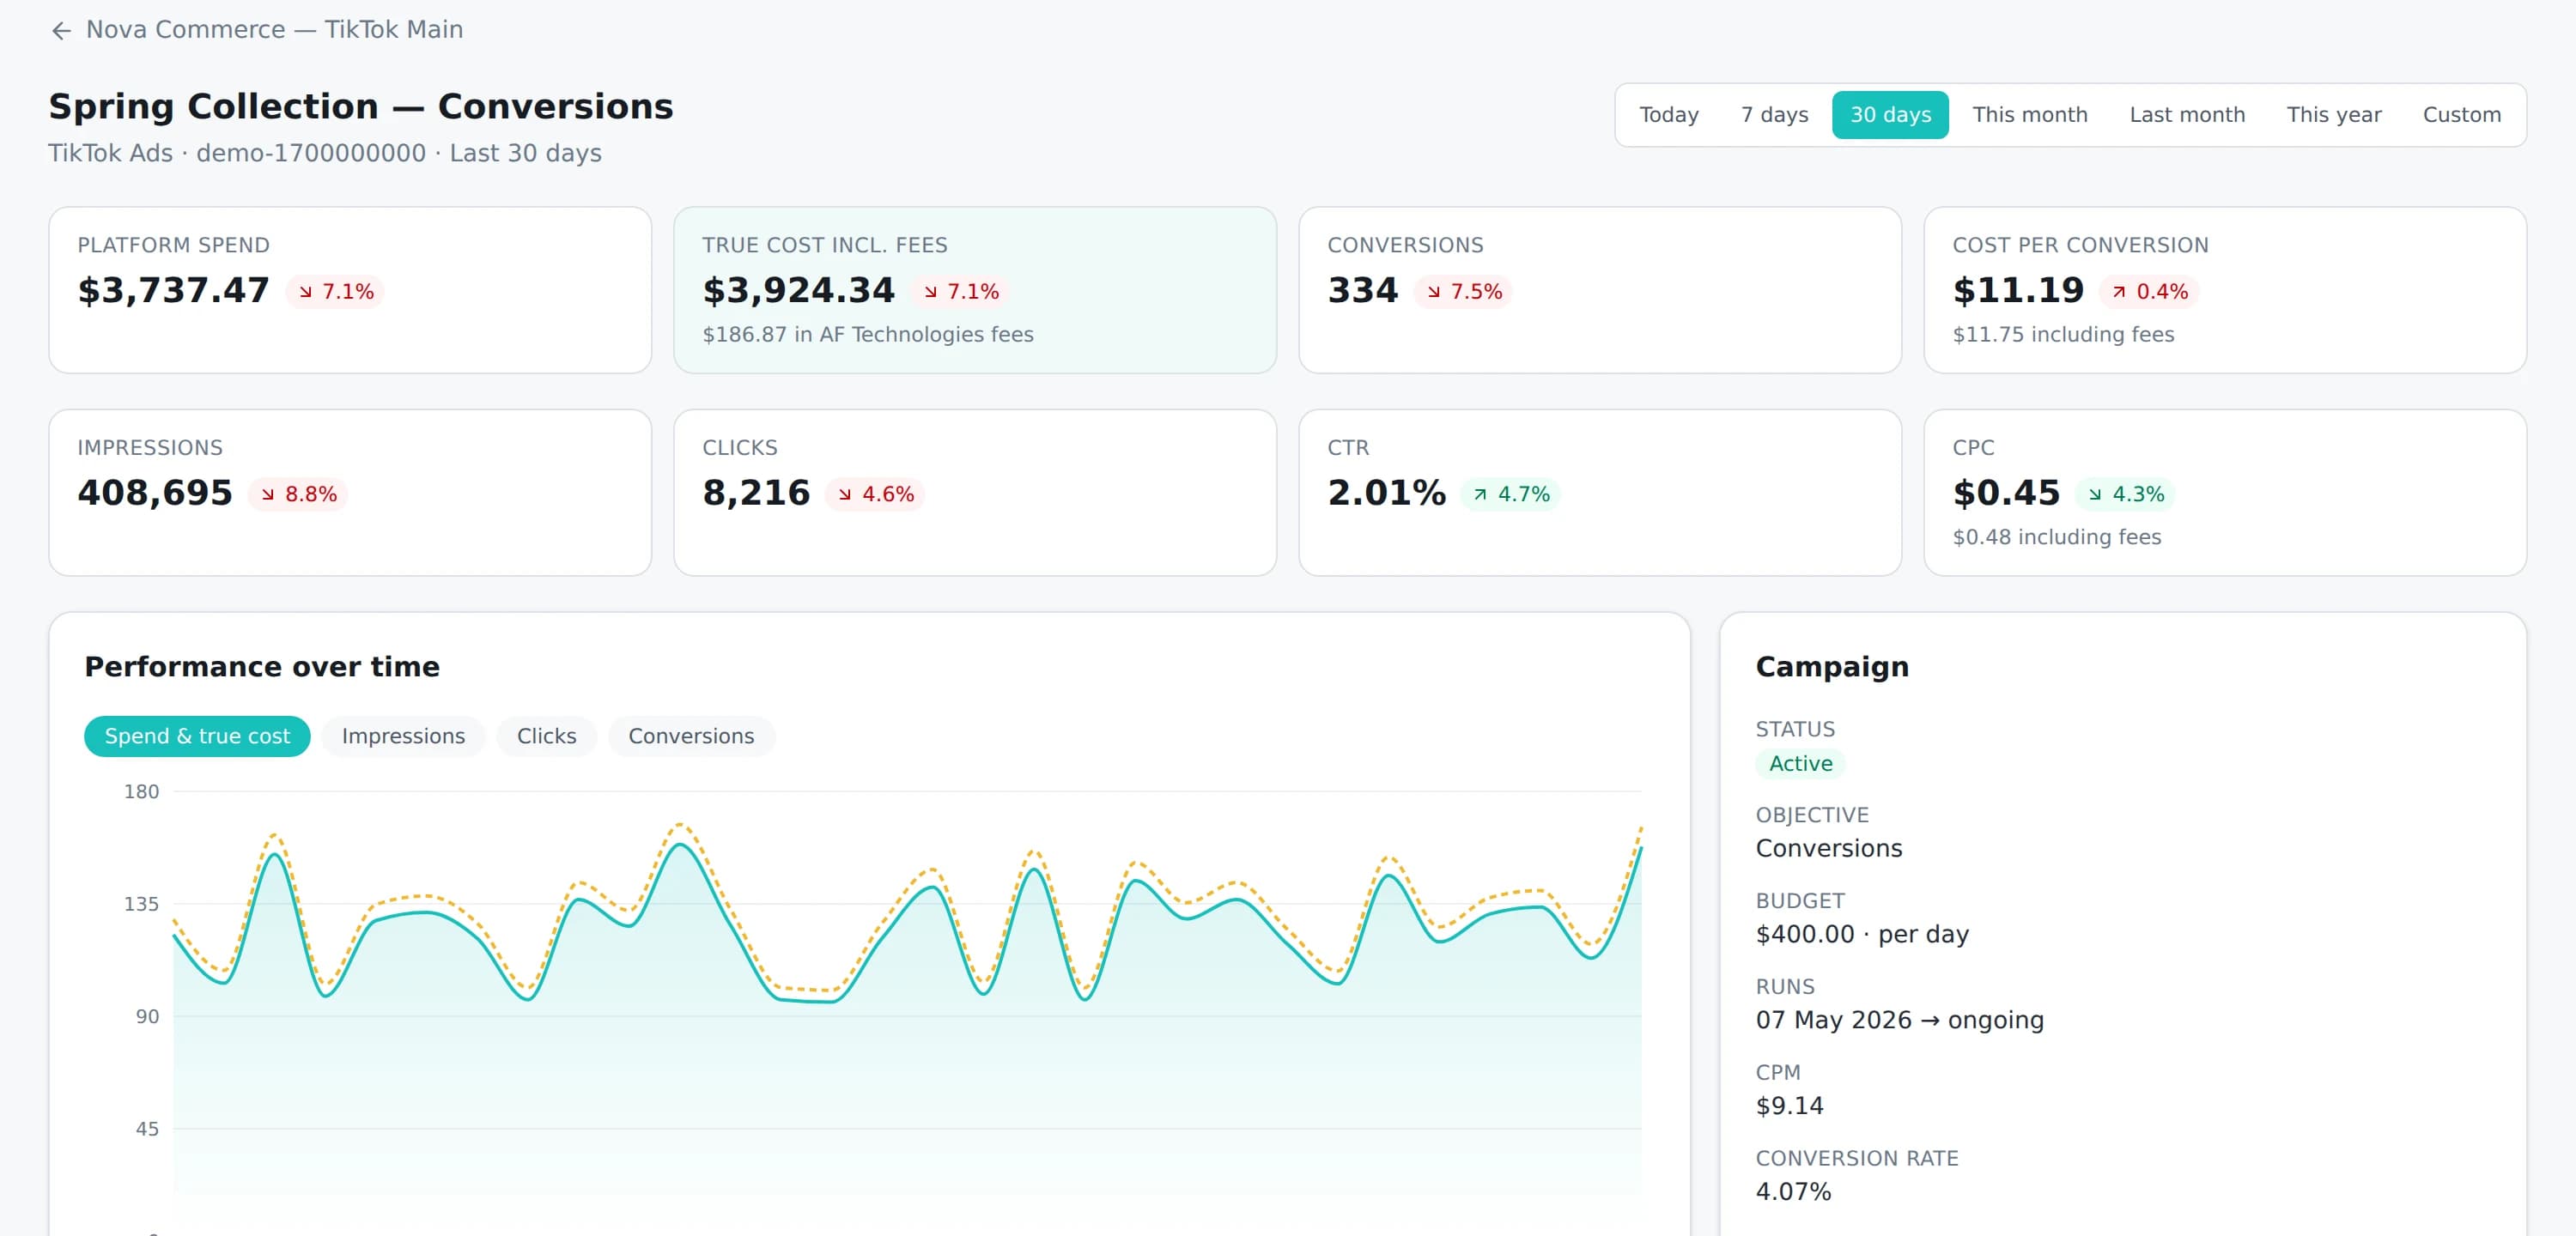
Four levels, each carrying the same metrics, so a figure means the same thing wherever you are looking at it. Account-level answers where the money went; ad-level answers which creative earned it.
Account
Spend, total advertising cost, balance, estimated runway and delivery status across everything running in that account.
Campaign
Objective, budget, status and daily performance, sortable by any metric so the worst performer is one click away.
Ad group
Optimisation goal and placement, with the campaign's totals broken down — where a rise in cost per conversion is usually traced to.
Ad
Creative format, call to action, per-ad performance, and the reason if a platform refused it.
Comparison
A number on its own tells you nothing
Cost per conversion of $14 is neither good nor bad until you know what it was last week. Every figure in the dashboard carries its change against the preceding period of the same length.
- Day against day, for spotting a campaign that broke this morning
- Any custom range against the range immediately before it, of equal length
- Month against month, for the trend that daily noise hides
- Daily performance charted across a campaign's whole run
Comparisons are always like-for-like: a seven-day range is compared against the seven days before it, never against a calendar month. Anything you are looking at can be exported to CSV, including the comparison figures.
Glossary
What each metric means
Everything below is recomputed from the counters the advertising platform reports rather than stored, so a rate can never drift from the numbers behind it. Where there is arithmetic, it is shown.
- Impressions
- How many times your ads were displayed. One person seeing an ad three times is three impressions.
- Reach
- How many distinct people saw your ads. Always lower than impressions, and the gap between the two is how often the same person is seeing you.
- Clicks
- How many times someone clicked an ad. What counts as a click varies slightly by platform — Snapchat, for instance, reports swipe-ups.
- CTR — click-through rate
clicks ÷ impressions - The share of impressions that produced a click. The usual first signal that creative is working or fatiguing.
- CPC — cost per click
spend ÷ clicks - What you paid on average for each click. Useful within a platform, misleading across platforms with different intent.
- CPM — cost per mille
(spend ÷ impressions) × 1,000 - What it costs to show your ads a thousand times. The cleanest measure of how expensive an audience is to reach, independent of whether your creative earns clicks.
- Conversions
- Actions the platform attributes to your advertising — a purchase, a sign-up, a lead. Depends entirely on your conversion tracking being installed and configured.
- Conversion rate
conversions ÷ clicks - The share of clicks that converted. We compute it against clicks, not impressions.
- Cost per conversion
spend ÷ conversions - What each result cost you. The metric that compares honestly across platforms, because it is indifferent to whether a platform sells cheap clicks or expensive ones.
- Platform spend
- What the advertising platform charged your account. This is the figure the platform's own dashboard shows.
- Total advertising cost
- Platform spend plus the service fee charged when you funded the account. The figure that answers what the advertising actually cost you, which the platform's own reporting cannot know.
- Estimated runway
- Roughly how long the remaining balance lasts at the current rate of spend. An estimate, and it moves whenever daily spend does.
What we do not claim
- Availability depends on the platform. Advertising platforms differ in what they report and how they attribute a conversion. Where a figure is not reported for your account we show that it is missing rather than showing a zero.
- Revenue and ROAS are not calculated yet. Those depend on conversion values coming through your own tracking setup. We would rather not show them than show them confidently wrong.
- Figures follow the platform, including its restatements. A platform that revises a day's numbers changes ours too.
- Automatic syncing covers TikTok today. TikTok is the platform our integration reads from directly. Accounts on Meta, Google and Snapchat are supplied and funded in the same way, and their campaign figures are loaded from the platform's own reporting into this same dashboard until each connector is built. Funding, fees and total cost are our records and are exact on every platform.
AI recommendations
Available nowTurn campaign data into clearer decisions
Every metric above is reported whether or not you ever ask for this. When you do, the analyst reads that period's figures and writes a short second opinion — what needs attention, why, and what to do about it. Ask it about a video ad and it reads the watch-through figures beside frames from the ad itself, so a finding can name what was on screen where people stopped.
- Every figure calculated in verified code, never by the model
- Each recommendation naming the metrics it is based on
- A priority on every one, so you know what to read first
- Video ads read against their own frames, not just their numbers
- The campaign objective taken into account, so a video is not judged on conversions it never bought
- Included with every package, at no extra cost
Recommendations are suggestions, not predictions. They do not guarantee results, and AF Ads never changes your campaigns — nothing is paused, scaled or edited automatically. There is no write access to your accounts anywhere in the platform.
Where the numbers come from
Why you can check our figures
A reporting product is only worth the confidence you have in it, so it is worth saying how this one is built.
Performance figures are read from the advertising platform's own reporting API and are not adjusted. Rates like CTR and cost per conversion are recomputed from the underlying counters each time they are shown rather than stored, which is what stops a rounded rate drifting away from the numbers it came from.
Financial figures come from a separate source: an append-only ledger recording every wallet top-up, every account funding and every fee. Nothing in it is edited or deleted, so a balance is always the sum of its entries and can be checked one line at a time.
That separation is deliberate — platform data can be restated by the platform, your money cannot be restated by anybody. More about how AF Ads works, and what we will not claim.
Why the platform's own spend figure is never the whole cost, and how to correct for it if you are measuring this yourself, is covered in what your advertising actually costs.
See it with your own campaigns
The reporting is included with every account and every package. Nothing extra to buy, nothing to connect.